- Giving users the permission to Maintain the Farm Dashboard can be done by changing security roles.
The Dashboard provides you with an easy way to analyse farm performance, access FarmIQ activities, and run reports.
You have access to two Dashboards:
Watch this video for an overview of how to view and set up your Dashboard:
| All FarmIQ Packs |
|---|
|
Download the PDF here. |
|
|
|
Both Dashboards can be customised. You can select which items to display.
On the Dashboard you can:
The following image shows you how to find and customise the Dashboard.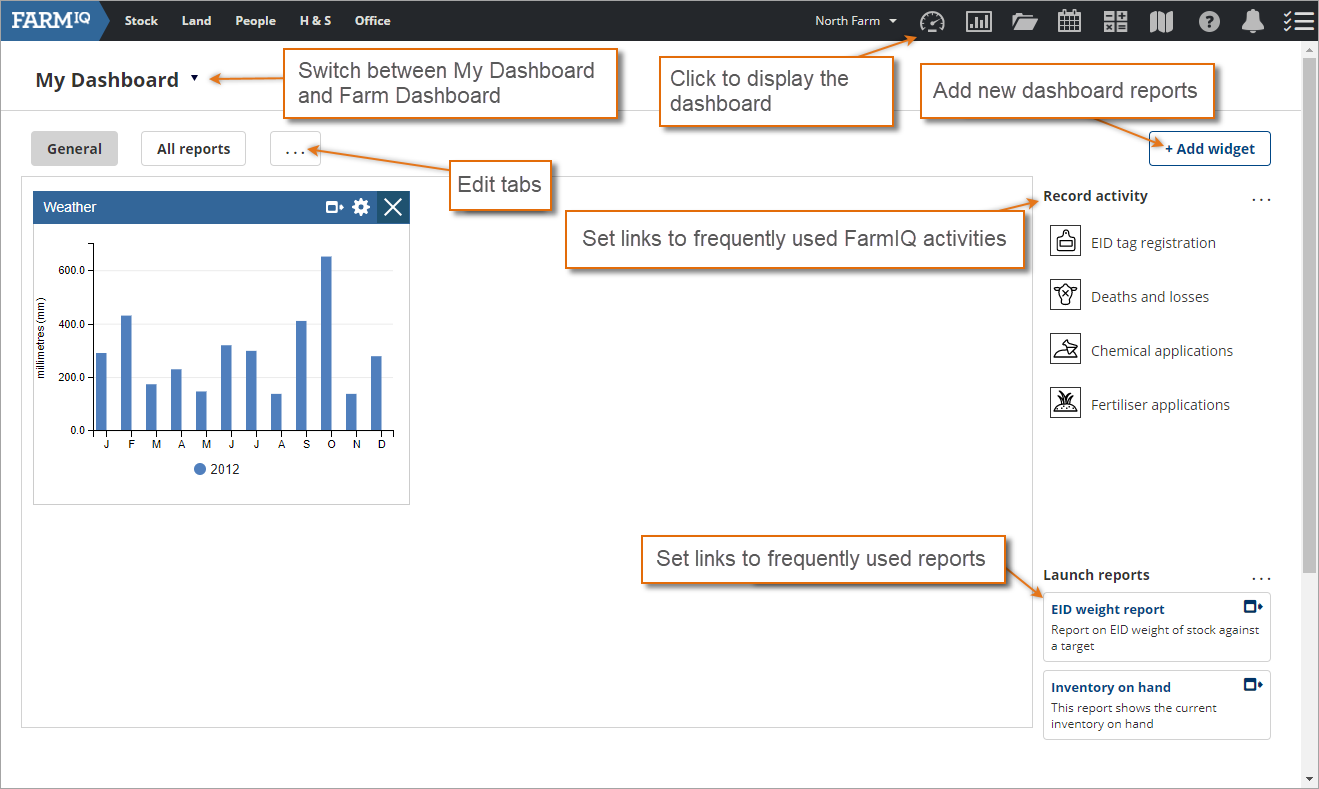
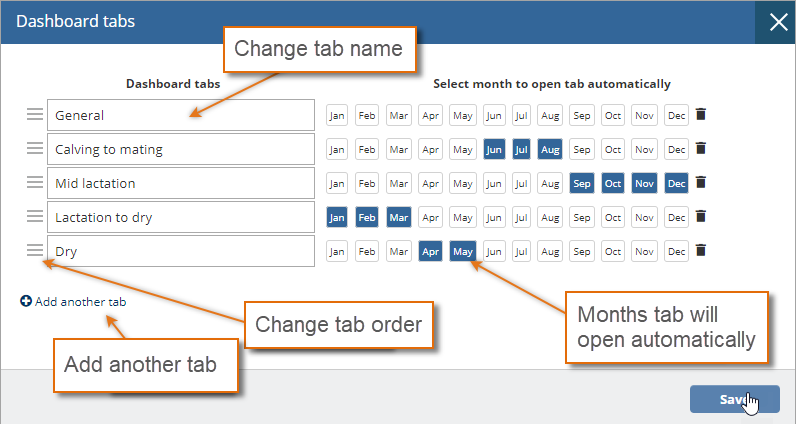
You can run one tab for all your dashboard reports or multiple for different reporting areas. You can edit tabs by
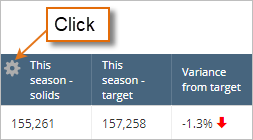
If you are using FarmIQ Pro or Performance+ with Dairy, your dashboard has a Dairy summary. This table shows dairy data from your milk data feeds regarding milk solids, cows, somatic cell count and pasture cover. You can select which information you want to see in the table.
|
|
In the Dairy summary table, Cows milking refers to the number of cows in Milking category herds. |
To select the columns for the Dairy summary: