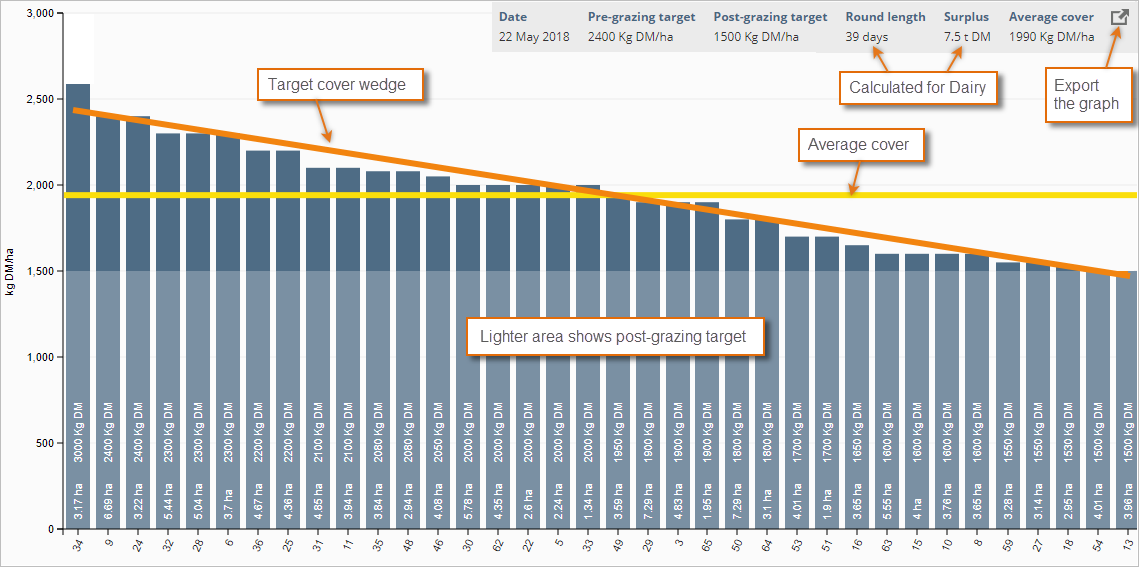
This report shows a pasture wedge for selected paddocks or blocks for a specified date range. If you select more than one block, the paddocks in each block are shown in a different colour on the graph.
Measuring cash results from grazing plans – FarmIQ return on investment
Wairarapa farmer Matt used FarmIQ to compare lamb weight gain on different grazing plans – the difference was worth $0.13/head/day. See more.
Measuring cash results from grazing plans – FarmIQ return on investment
Wairarapa farmer Matt used FarmIQ to compare lamb weight gain on different grazing plans – the difference was worth $0.13/head/day. See less.
Matt tracked ewes with lamb at foot and compared set stocking against rotational grazing, using weights captured from his scale head and analysed with FarmIQ's tools.
His rotationally grazed animals had gained extra weight worth more than $5/head between docking and weaning - which is significant when you’re carrying 18,000 animals!
Read the full story: Measuring FarmIQ return on investment in cold hard cash.
Other tools used:
You can:

|
|
The dairy option requires you to set up the report for selected farm walks.
If you enter pre- and post- grazing targets, the System calculates any surplus or deficit when you view the report.
You can use the report filter to calculate any one of: post-grazing target, pre-grazing target, available area, number of cows, pasture intake or round length, if the other five variables are known.
Below the graph there is a table showing detailed pasture cover information for each paddock in the report.
To see and export the Pasture wedge report:
or


