
- You must add weight targets before you can use the Weight target report.
- You can only report by event category if you have selected an event category when you recorded the weights.
This report allows you to compare animals born in a selected financial year against:
The report can be set up to use all recorded weights or only weights recorded with an event category. You can include grazing off stock if you want to.
|
|
|
The report has a graph and a table.
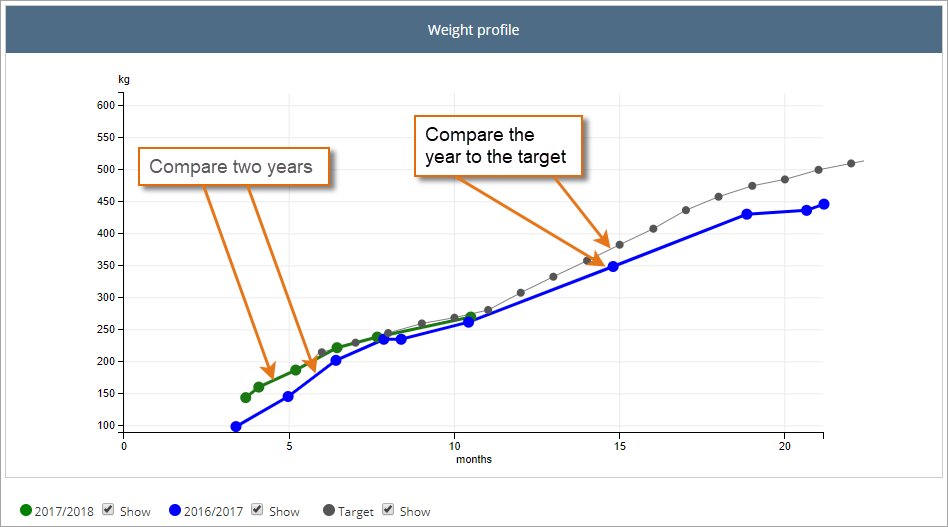
You can set up the weight target report graph to show the weight target and average weights for animals born in selected financial years. You can then use the lines to compare animal performance against your target and against animals born in different financial years, at the same age, as shown in this example:
|
|
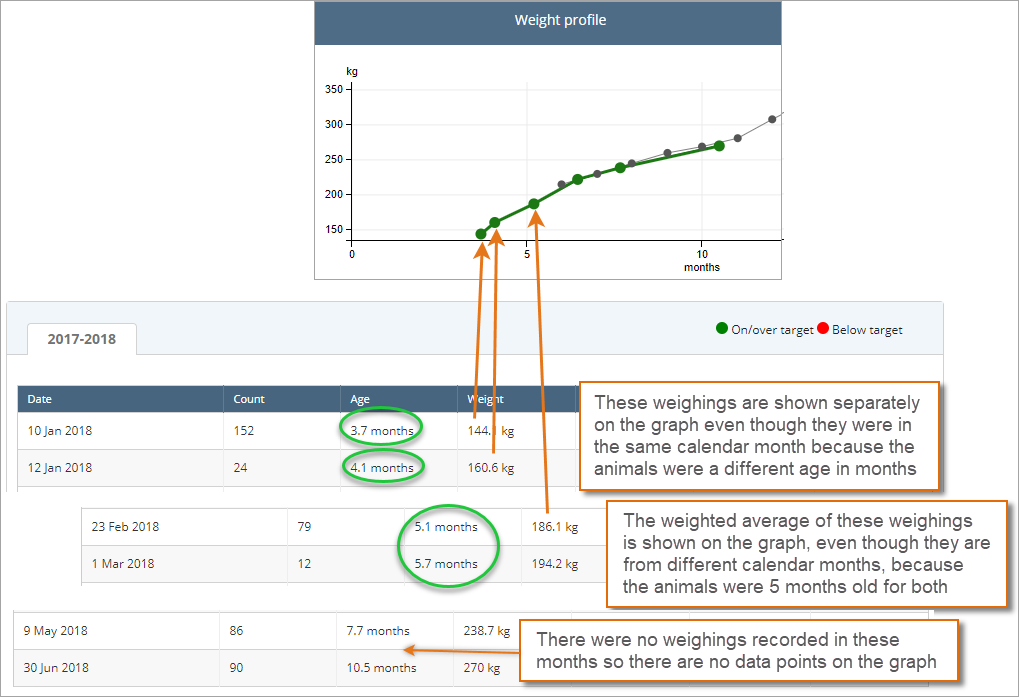
Age months The graph shows how many months old the animals are, based on their birth date, not on calendar months. We will refer to the months in the graph as 'age months'. |
Weight targets are set up for animals using their age in months. These are shown as a grey line on the Weight target report graph if selected.
Recorded weights shown on the Weight target report graph are the average weights for all the animals in the target group that were weighed in the age month. The average weights are shown on the weighted average date of the weighings for each age month. A dot is only shown on the graph if weights were recorded in the age month.
Further explanation
If any weighings have been recorded in an age month, there is only one data point on the graph for that age month, no matter how many weighings have been recorded. The data point shows the average weight for the age month for all the animals in the target group that have been weighed and is on the weighted average date for weighings in that age month.
This image shows an example:
The weight target report table contains detailed information for each weighing event recorded including a comparison with the target set for that age. Each year selected is shown on a different tab.
The Weight target report table shows the following information for each weighing event:
| Column | Information |
|---|---|
| Date | Date of the weighing event. |
| Count | Count of animals in the weighing event. |
| Age | Average age of the animals at the time of the weighing. |
| Weight | Average weight. |
| Target | Target weight for that age. |
| Compared target | Difference between the target weight and the average recorded weight. Weight differences that are on or over target are green and weight differences that are below target are red. |
| Gain from birth | Weight gain per day from birth up until that weighing event. |
 To set up and view the weight target report
click here
To show or hide lines on the graph
click here
To set up and view the weight target report
click here
To show or hide lines on the graph
click here
To show or hide a line use the checkboxes under the graph:
| To... | Then... |
|---|---|
|
Show a line on the graph.
|
Select the checkbox.

|
|
Hide a line on the graph.
|
Clear the checkbox.

|
To change the report criteria
click here

