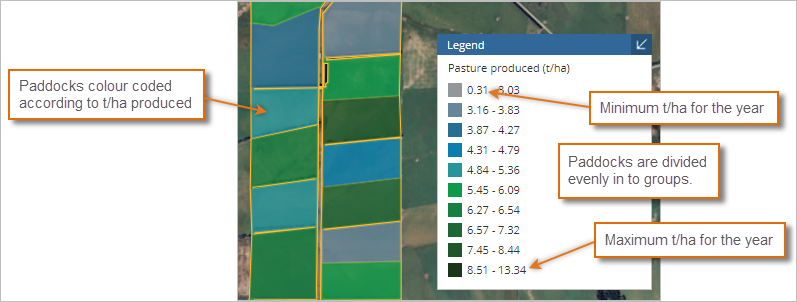
The pasture production report shows the amount of pasture produced in each paddock in a selected year on the map.
For this report, pasture production for the year is calculated for each paddock that has had pasture recorded. The paddocks are then sorted in order of tonnes/ha production and evenly divided into 10 groups. The legend shows the range of pasture production for each group next to the colour of the paddocks in that group on the map.
You can select which season you want to view.
You can open this report from the Farm map, in Layers, or from the Report centre, under Land.
You can also set up a quick link to launch it from the Dashboard.
To view the Pasture production report:
 , click Land to expand it.
Once you've opened the report, levels of pasture produced during the selected season are shown on the map.
 .
.
To change the report period, choose calendar or financial year and select the Season then click View.
|
To...
|
click... |
|---|---|
| change the background... |
View and select a map background.
|
|
hide or show labels for the Paddock name, Pasture produced or Effective area...
|
the switches under Labels at the bottom of the left panel.
|
|
measure distances or areas on the map...
|
Measure.
|
|
print or save the map...
|
Print.
|